
Just a place for me to jot down some useful commands when working with the Ubuntu command line.
General Commands
Commands I use often:
| Command | Explanation |
|---|---|
pwd |
Print the working directory |
ls -lha |
List the contents of the working directory, +all files +human readable filesizes +long format |
cd - |
Go back to the previous directory |
df -h |
Show used / available space by partition |
top or htop |
Show current running processes |
ps -A | less & kill ... |
List all processes, kill a process |
sudo ps aux | grep MY-PROC-NAME |
Find a process with a given name |
rm -rf |
Remove a directory +recursive +force |
sudo -u www-data COMMAND |
Run a COMMAND as another user |
adduser USERNAME |
Add a user |
usermod -aG sudo USERNAME or adduser USERNAME sudo |
Add user USERNAME to the sudo group |
sudo passwd USERNAME |
(Re)set the password for a user |
sudo chown -R www-data:www-data * |
Recursively change the ownership or all files and folders in/under the current directory (to user/group www-data) |
sudo chmod g+w -R /var/www/xyz.com/ |
Add write privilege for the group recursively for the given directory |
hostnamectl set-hostname new-hostname |
Set the host name |
vi /etc/hosts |
Edit the hosts file |
tail -f ... |
Watch the "tail" of a file |
su -www-data |
Switch to user www-data |
find . -iname "mysql-bin.000*" |
Find files |
locate -i filename |
Find a file (faster, needs apt-get install locate and then sudo updatedb) |
Read UsingTheTerminal for a good overview of...using the terminal!
Apache
| Command | Explanation |
|---|---|
a2ensite ... |
Enable a site |
a2dissite ... |
Disable a site |
systemctl reload apache2 |
Reload apache |
a2query -s |
List all enabled sites (Apache) |
apache2ctl -S |
List all enabled sites (Apache, another method) |
SSH
| Command | Explanation |
|---|---|
vi /etc/ssh/sshd_config |
Edit config (for example, disable un/pw login) |
sudo service sshd restart |
Restart sshd (and apply changes in sshd_config) |
To enable un/pw access for a specific IP range only, you can add to the end of the file:
# Settings that override the global settings for matching IP addresses only
# Allow un/pw auth for home NAS:
Match address 111.222.333.444
    PasswordAuthentication yes
Services
| Command | Explanation |
|---|---|
service --status-all |
List all services |
Performance and Resource Monitoring
| Command | Explanation |
|---|---|
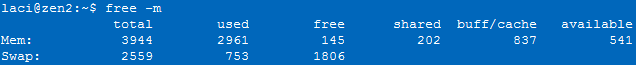
free -m |
Overview of aggregate memory usage |
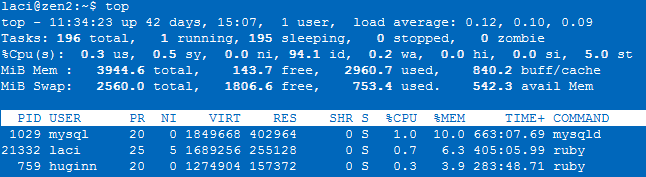
top |
Listof processes ordered by CPU and memory usage |
Or install htop:
sudo apt-get install htop and then sudo htop
Midnight Commander
| Keys | Explanation |
|---|---|
INS |
Select files |
* |
Reverse selection (or select all files, if nothing was selected) |
CTRL+o |
Access the quick shell |
ALT+, |
Switch panel layout between horizontal and vertical |
ALT+i |
Show current directory in the other panel as well |
CTRL+u |
Swap panels |
ALT+SHIFT+h |
View your directory history |
ALT+? |
Find a file |
CTRL+SPACE |
Calculate file size (use it on .. to calculate all) |
CTRL+x...d |
Compare directories |
Certbot
CertBot for deploying https: https://certbot.eff.org/lets-encrypt/ubuntuxenial-apache
CRON
You can place scripts to run every day/week/month into /etc/cron.daily/weekly/monthly, but make sure that the files are executable and that they don't contain any special characters (or even an file ending).
Make a file executable: sudo chmod +x /etc/cron.hourly/backup.sh
Better yet, make sure they have the correct permissions: chmod 600 /etc/cron.d/*
You can find out about when these scripts will be run with cat /etc/crontab
# /etc/crontab: system-wide crontab
# Unlike any other crontab you don't have to run the `crontab'
# command to install the new version when you edit this file
# and files in /etc/cron.d. These files also have username fields,
# that none of the other crontabs do.

SHELL=/bin/sh
PATH=/usr/local/sbin:/usr/local/bin:/sbin:/bin:/usr/sbin:/usr/bin

# m h dom mon dow user  command
17 *    * * *   root    cd / && run-parts --report /etc/cron.hourly
25 6    * * *   root    test -x /usr/sbin/anacron || ( cd / && run-parts --report /etc/cron.daily )
47 6    * * 7   root    test -x /usr/sbin/anacron || ( cd / && run-parts --report /etc/cron.weekly )
52 6    1 * *   root    test -x /usr/sbin/anacron || ( cd / && run-parts --report /etc/cron.monthly )
You can see if your script runs by running the appropriate part from the above output, for example to run your weekly cron jobs right now: test -x /usr/sbin/anacron || ( cd / && run-parts --report /etc/cron.weekly )
Force a cron job to run by "touching" it's definition: touch /etc/cron.d/mycronscript
(root) INSECURE MODE (mode 0600 expected) (crontabs/root)
Fix this with:
 sudo chmod 600 /var/spool/cron/crontabs/root
 sudo touch /var/spool/cron/crontabs
Debug a Cron Job
Two methods come in handy. The first one from a post by rubiojr on askubuntu:
Do not redirect error output to /dev/null and grep /var/log/syslog for cron output.grep cron /var/log/syslog
You can immediately show errors when saving a file after editing /etc/crontab or files inside /etc/cron.d/ with:tail -f /var/log/syslog | grep --line-buffered cron
If the edit is ok, you will only see the RELOAD notice, errors will occur likeJul 9 09:39:01 vm cron[1129]: Error: bad day-of-month; while reading /etc/cron.d/new
You can also see your active cron jobs with crontab -l. But this doesn't show you jobs set in cron.d or cron.daily etc.
The second method is to make your cron job log to a file! See below.
Make a Cron Job Log to a File (with timestamp prepended!)
The following worked for me to redirect output of a cron job to a log file, and to prepend a timestamp at the beginning of the first line. It's also really a great way to debug!
SHELL=/bin/sh
PATH=/usr/local/sbin:/usr/local/bin:/sbin:/bin:/usr/sbin:/usr/bin

* * * * * www-data { printf "\%s: " "$(date "+\%Y-\%m-\%d \%H:\%M:\%S")"; php /var/www/domain.com/public_html/artisan schedule:run ; } >>/var/www/comain.com/cron_log.log 2>&1
Or if you don't need to prepend a timestamp, just output it to a temprorary log file by appending this to your cron line: >>/tmp/cron_log.log 2>&1
You can also simulate a cron job run with run-parts /etc/cron.daily (for example). However, this doesn't fully simulate the cron environment, so you should also set it to run once a minute and wait for the output to be written to your logfile.
The example task above if for running the OctoberCMS scheduler once every minute.
- How to add timestamp to log output entries with cron?
- How to add the logs to a crontab with time stamp
- Sending cron output to a file with a timestamp in its name
Free Up Disk Space
Methods for finding large files/folders:
(1) apt-get install ncdu or gt5 & run from the root directory!
(2) Or resort to the command line:
du -a | sort -nr | head
sudo du -a | sort -nr -T /media/usb-key
-- Or if disk is full and the above doesn't work because the temp folder is full:
sudo du -ah --max-depth=1  / | sort -hr
-- You can also find files larger than X mb:
find / -size +10M -ls
Often there are lots of files at: /var/cache/apt/archives
Old apt files are archived here. You can delete them with:
sudo apt-get clean
sudo apt-get autoclean
MSSQL
Enable SQL Server Agent
Agent is disabled by default. Enable it with:
sudo /opt/mssql/bin/mssql-conf set sqlagent.enabled trueClear up the error logs...
MSSQL fills up your server with error logs after a while. You could...
In SQL Server Management Studio, open the MANAGEMENT folder, then right click on SQL SERVER LOGS and say CONFIGURE. Check the LIMIT ERROR LOGS box and set the number to 30 (a month's worth). Now, set up a new job in the SQL Agent that runs sp_cycle_errorlog every night at midnight. (source)
except that this doesn't work on Linux. Instead, read this excellent post on the topic as well as How to configure the number of error logs for your SQL Server instance on Linux! In short:
sudo /opt/mssql/bin/mssql-conf set errorlog.numerrorlogs 6
...
sudo systemctl restart mssql-server.service
...
Check that your config was applied with:
sudo cat /var/opt/mssql/mssql.conf
But note!
After you implement this configuration change, you have to manually get rid of the additional error log files that existed before this configuration change went into effect. In the above example, those would be errorlog.7 onwards that needs to be manually cleaned.
Antivirus
Supposedly you don't need one, but ClamAV is free to use and simple enough.
Installation and use:
sudo apt install clamav clamav-daemon
sudo freshclam

Scan the whole system, report on any infected files (but don't remove):
sudo clamscan --max-filesize=3999M --max-scansize=3999M --exclude-dir=/sys/* -i -r /

Scan the home directory and remove and move infected files:
clamscan --infected --remove --move=/home/<user>/viruses --recursive /home
Note: installing clamav and the daemon will result in a daily update of your virus definitions. On a small node this may end up leading to problems. For example, your java processes might get killed off (in my case, Jira).
To disable freshclam, run: sudo update-rc.d clamav-freshclam disable (ref) however it will come back after a reboot.
To uninstall ClamAV, run:
apt-get remove freshclam
There is also a gui client: sudo apt install clamtk
Other options:
Docker
| Command | Explanation |
|---|---|
docker container ls |
List all containers |
docker container stop |
Stop a container |
docker container rm |
Remove a container |
docker image ls |
List all docker images |
docker image prune |
Remove unused docker images |
docker image rm ... |
Remove a docker image |
For more commands see the docker docs!
Upgrade your Ubuntu Version
sudo apt-get update
sudo apt-get upgrade
sudo apt-get dist-upgrade
do-release-upgrade
Security Audit & Incident Respone
Identify services running locally
sudo netstat -plunt
Scan for open ports on another host
- Install nmap:
sudo apt-get install nmap - Scan for every TCP and UDP open port:
sudo nmap -n -PN -sT -sU -p- remote_host - See what service is running on a port:
sudo nmap -PN -p port_number -sV remote_host
Sources:
Logs
- /var/log/syslog
Check Recent Logins
sudo less /var/log/auth.log
last
lastlog
lastb
Scan System for Viruses
sudo apt install clamav
sudo systemctl stop clamav-freshclam
sudo freshclam
sudo systemctl start clamav-freshclam
clamscan --remove=yes -i -r /
Find All Files that do not end with...
sudo find . -type f ! '(' -name '*.jpg' -o -name '*.png' ')'Monitoring
MMonit
Monit is a small Open Source utility for managing and monitoring Unix systems. Monit conducts automatic maintenance and repair and can execute meaningful causal actions in error situations. Monit has built-in a lightweight HTTP(S) interface you can use to browse the Monit server and check the status of all monitored services. From the web interface, you can start, stop and restart processes and disable or enable monitoring of services.
https://cloudwafer.com/blog/installing-monit-on-ubuntu/
Installing monit:
- Install and Configure Monit on Ubuntu 20.04|18.04
- How To Install And Configure Monit On Ubuntu 20.04 LTS
sudo apt-get update && sudo apt-get upgrade
sudo apt install monit
sudo monit
sudo systemctl status monit
sudo vi /etc/monit/monitrc
# ... enable the http interface
sudo systemctl restart monit
sudo systemctl enable monit
By default the web interface is at: http://127.0.0.1:2812/
Monit configuration files are located under /etc/monit/ directory.The main configuration file is /etc/monit/monitrc. This file is highly commented out, you can reference it for all configs. By default all files located on /etc/monit/conf.d/ and /etc/monit/conf-enabled/ are read by monit when it is started, you can place your process monitoring configurations on this directory to keep things organized.
| Command | Explanation |
|---|---|
monit status |
Show status |
monit reload |
Reload configuration files |
service monit restart |
Reload monit service |
sudo monit -t |
Check config files |
monit summary |
Show summary |
Monitor Apache & MySql 8 with Monit:
CREATE USER 'monit'@'host_from_which_monit_performs_testing' IDENTIFIED BY 'mysecretpassword';
 FLUSH PRIVILEGES;
Then create /etc/monit/conf.d/mysql:
check process mysql with pidfile /var/run/mysqld/mysqld.pid
     start program = "s/usr/sbin/service start mysql" with timeout 60 seconds
     stop program = "/usr/sbin/service stop mysql"
     if failed
        port 3306
        protocol mysql username "monit" password "…"
     then alert
Unfortunately the above does not work well if /etc/mysql/mysql.conf.d/mysqld.cnf is configured with bind-address = 127.0.0.1
This answer is probably why:
@Matchu your webapp probably isn't connecting to localhost (127.0.0.1), but is either using the 172.etc IP address, or connecting via a UNIX socket (which netstat also says is open). I'm pretty sure a lot of APIs will immediately prefer a socket if "localhost" is specified, which somewhat masks this issue. – Daniel Lawson Jan 12 '11 at 3:44
I also tried to allow connections via unix socket in mysqld.cnf and configure monit exactly as follows:
check process mysql with pidfile /var/run/mysqld/mysqld.pid
     start program = "/usr/sbin/service start mysql" with timeout 60 seconds
     stop program = "/usr/sbin/service stop mysql"
     if failed
        unix "/var/run/mysqld/mysqld.sock"
        protocol mysql username "monit" password "…"
     then alert
but this didn't work either. So, just comment out the "#if failed..." part.
To monitor apache, follow this tutorial: Configure Monit For MySQL, Apache, NGINX On Ubuntu 20.04 LTS
# Monit - Apache - Default configuration
cat /etc/monit/conf-available/apache2
sudo ln -s /etc/monit/conf-available/apache /etc/monit/conf-enabled/
# Disable conf - if saved in conf-available
sudo rm /etc/monit/conf-enabled/apache
# OR
sudo unlink /etc/monit/conf-enabled/apache
sudo monit reload
Email Alerts with Monit on SSH Logins
Configure your mail settings in /etc/monit/monitrc, this is what worked for me:
...
set mailserver x@x.com port 465 username "x@x.com" password "x" using tls with timeout 5 seconds
...
set mail-format { from: x@x.com }
set alert x@x.com
set alert x@x.com not on { instance, action }
Create a new monitoring configuration file in /etc/monit/conf.d/ called ssh_logins:
check file ssh_logins with path /var/log/auth.log
  ignore match "/etc/monit/whitelist_ips.regex"
  alert x@x.com with mail-format { subject: "SSH login on X!" }
  if match "Accepted publickey" then alert
For more detailed instructions, see:
Sources / further reading:
- Use Monit to Monitor + Restart MySQL Service Automatically
- Monitoring and Restart MySQL Service Automatically with Monit
- LEMP Stack Monitoring with Monit on Ubuntu 14.04
- Configure Monit For MySQL, Apache, NGINX On Ubuntu 20.04 LTS
- https://mmonit.com/monit/documentation/monit.html#MYSQL
- Tom's Linux Tips - Monit & MMonit
Red Hat Cockpit
The easy-to-use, integrated, glanceable, and open web-based interface for your servers
https://cockpit-project.org/
Install with:
sudo apt-get install cockpitYou should then be able to access the web interface at: http://127.0.0.1:9090/
NetData - 50k ★ on GitHub!
Netdata's distributed, real-time monitoring Agent collects thousands of metrics from systems, hardware, containers, and applications with zero configuration. It runs permanently on all your physical/virtual servers, containers, cloud deployments, and edge/IoT devices, and is perfectly safe to install on your systems mid-incident without any preparation.
https://github.com/netdata/netdata#documentation
Install by simply running (without sudo):
bash <(curl -Ss https://my-netdata.io/kickstart.sh) --stable-channel --disable-telemetryYou can then access the web interface at: http://127.0.0.1:19999/
- Get started guide
- Single-node monitoring with Netdata
- Health quickstart
- Alarm notifications
- Telegram
