
Have you ever needed to step into .Net code? Unfortunately doing so can be a real pain. Supposedly setting your debug options (Options → Debugging, "Enable .NET Framework source stepping" and "Enable source server support") and using "Microsoft Symbol Servers" (Options → Debugging → Symbols) should "just work". Except when it doesn't. For example if you've installed any windows updates that have overwritten your .Net framework files. Or if Visual Studio just doesn't feel like it.
JetBrains dotPeek to the rescue! I've tried other methods but this was the only one that worked for me. This is a free piece of software that decompiles the files on your computer during runtime, spins up a symbol server on your machine, and serves the decompiled source code to your Visual Studio. It "just works"!
(1) Download JetBrains dotPeek and run it
Set Tools → Options as follows:
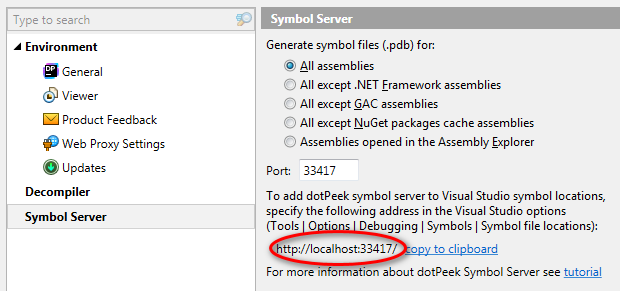
Use the copy to clipboard link to copy your local debug URL.
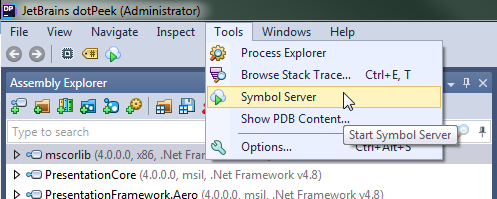
(2) Start the JetBrains symbol server:
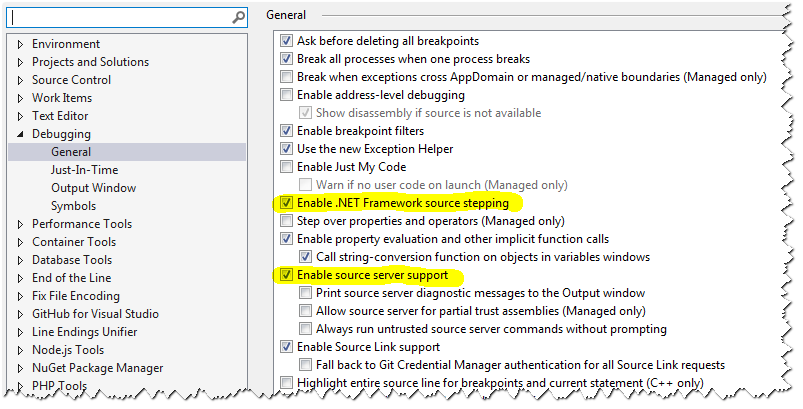
(3) Set Visual Studio debug options as follows:
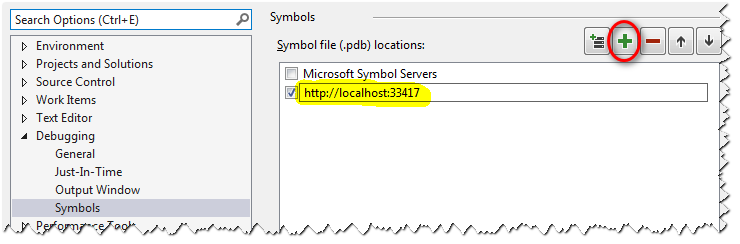
(4) And add the URL you copied in step (1) as a Symbol file location
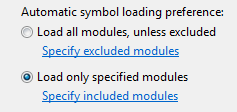
At the bottom of the dialog you can also optionally set to only load specific modules (leaving the default setting of "Load all modules" will force dotPeek to decompile a lot of DLL-s unnecessarily):
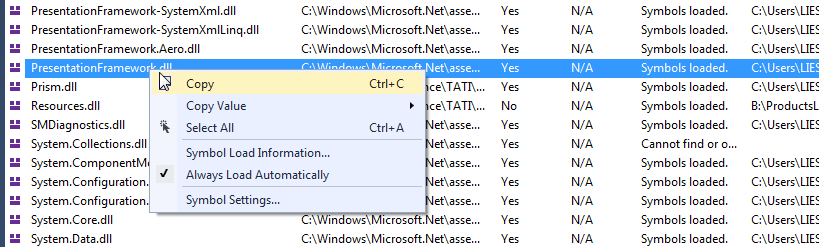
Run your application and open the Debug → Windows → Modules window. Here you can see which modules have been loaded, and from where, and you can also manually load a module if you set the option to only load specific modules in the previous step:
Good luck!
Reference
- SO: How do you enable “Enable .NET Framework source stepping”?
- SO: How do I debug .NET 4.6 framework source code in Visual Studio 2017?
- Microsoft: Configure Visual Studio 2013 for debugging .NET framework
- .Net Framework 4.8 Offline Installer
- Unable to step into PresentationFramework
- CFU's Technical Blog: Debug into .Net Framework Source Code
- MikeDoszhang: Visual Studio Debugger-Cannot debug into the .Net Framework source code problem
- SO: Cannot step into .NET framework source code
- Microsoft: How to: Debug .NET Framework source
